

The 15-Minute City and Post-COVID Urban Development Ideals, Part Three.
The 15-Minute City and Post-COVID Urban Development Ideals, Part Three.

The 15-Minute City and Post-COVID Urban Development Ideals, Part Three.
The first two parts of this essay introduced the concept of the 15-Minute City. Advocates for this ideal call for cities to reshape themselves to achieve the aspirational goal that all residents would enjoy access to six categories of services and amenities within a 15-minute walk or bike ride from they reside: affordable housing for all; job opportunities for all; a broad range of retail and commercial services; health care; lifelong education; and entertainment.
Most urban planners in the U.S. since the mid-20th century have shared the aspirational goal of having equitable access to all of these services for all city residents. But the dominant strategy for achieving equitable access has been to create specialized districts within a city for each type of service or amenity, and then to build transportation networks (mostly based on cars) to make each district accessible for all residents from the surrounding urban area. In other words, concentrate services in special districts and use transportation strategies to bring people to those services.
The 15-Minute City concept turns this upside down by focusing on bringing services to people. The result would yield an urban landscape comprised of many, relatively autonomous neighborhoods, defined largely by the 15-Minute walking and/or biking limits. Each neighborhood would contain its own portions of a much more decentralized approach to providing multiple services and amenities to city residents.
Equity could be achieved by assuring that each service node in the newly decentralized approach would provide the same high level of service in every part of the city. Each neighborhood would contain a mixture of housing options at all price levels (ownership and rental), a broad array of job opportunities, multiple levels of retail and commercial services, affordable health care and educational opportunities, and entertainment choices.
Advocates for the 15-Minute City vision argue that high quality services can be provided through radically decentralized, easily accessible locations in most urban systems today. This is because continual innovations in information and communications technology (ICT), and other fields of technological innovation, have driven down what economists call the “minimum efficient scale” (MES) of production in most service sectors. MES is a measure of the smallest scale of operations that can allow a service provider to offer competitive-quality services.
For example, hospitals traditionally provided their highest-quality diagnostic, therapeutic, medical-surgical, and recuperative health services by concentrating their most talented medical staff and their most sophisticated equipment in centralized, “main campus,” locations. Only routine general medical services could be provided in decentralized clinics and offices. Yet that is no longer true for many categories of health services. Hospital systems today pride themselves on making the largest proportion of their highest-quality services available to all patients regardless of location. New waves of innovation could continue enabling more decentralization.
Similar opportunities for decentralized, high-quality operational capacity, enabled by continual lowering of MES levels, can be found in retail and commercial services, educational services, and entertainment. And when those opportunities are added to the rapid growth in working-from-home that was sparked by the COVID-19 pandemic, one can sense the broad range of opportunities that exist today to begin steering cities toward the ideals of the 15-Minute City.
Yet cities don’t restructure themselves easily. Every city, and each neighborhood within every city, exists today as the unique result of the evolutionary trajectories of multiple, complex, intertwined, human-driven, urban systems. Any sustained strategy to bend the evolutionary trajectory of a city toward the 15-Minute City vision would need to engage city-level and neighborhood-level problem solving related to material systems, life-supporting systems, and perhaps most importantly, social systems.
Neighborhoods and the cities comprised of neighborhoods evolve by trying to solve one problem at a time, in one system or sub-system at a time. The Smart Cities movement holds much promise for arming urban problem-solvers with enough data to cultivate a pervasive civic culture of data-driven, pragmatic problem solving.
But as the second essay in this series discussed, few, if any, cities today have actually achieved all of the levels of data gathering and analysis that are envisioned by the Smart City movement. Even the most sophisticated cities in the World will take several decades for that to happen.
In the meantime, however, there are important signs of progress that can be used by local city and neighborhood problem solvers in the U.S. Most involve rather simple methods to squeeze information and insights from large administrative databases and from new data products that are produced by the U.S. Census Bureau.
Let’s use Cleveland as an example. In March of 2024 the City gave preliminary approval for planning reforms that would help pilot 15-Minute City principles in three specific neighborhoods: Hough, the Opportunity Corridor, and Detroit Shoreway/Cudell.
If we focus this brief discussion on the Hough neighborhood, the task for planners would be to gather descriptive data about Hough to assess how well its residents can obtain housing at different price levels; job opportunities; a broad range of retail and commercial services; health care; lifelong education; and entertainment within a 15-minute walk or bike ride from different locations within Hough.
Ideal conditions for Hough could be estimated based on the 15-Minute City principles. The ideal conditions could then be compared to Hough’s current conditions to identify the scale and scope of changes that would need to occur in the neighborhood to meet the 15-Minute City ideals. Residents could be engaged in a series of planning meetings to obtain their priorities, i.e. which gaps in the data are most important to address in the short-term, and which could be given lower priority.
Two sources of data that are relatively easy to access for this work are electronic data on all parcels of land in the neighborhood[1] and the U.S. Census Bureau’s geospatial data on labor market dynamics known as the LODES.[2]
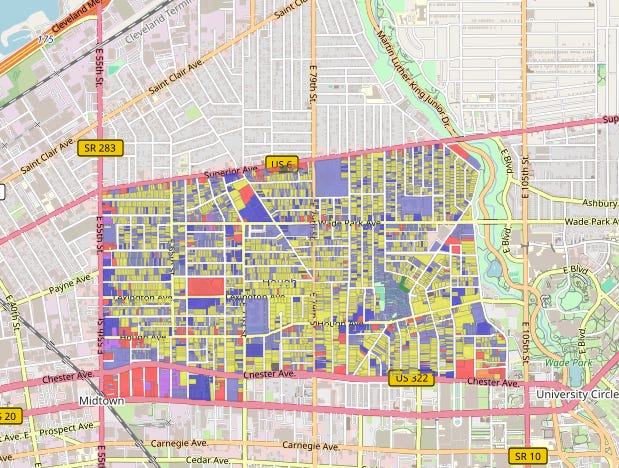
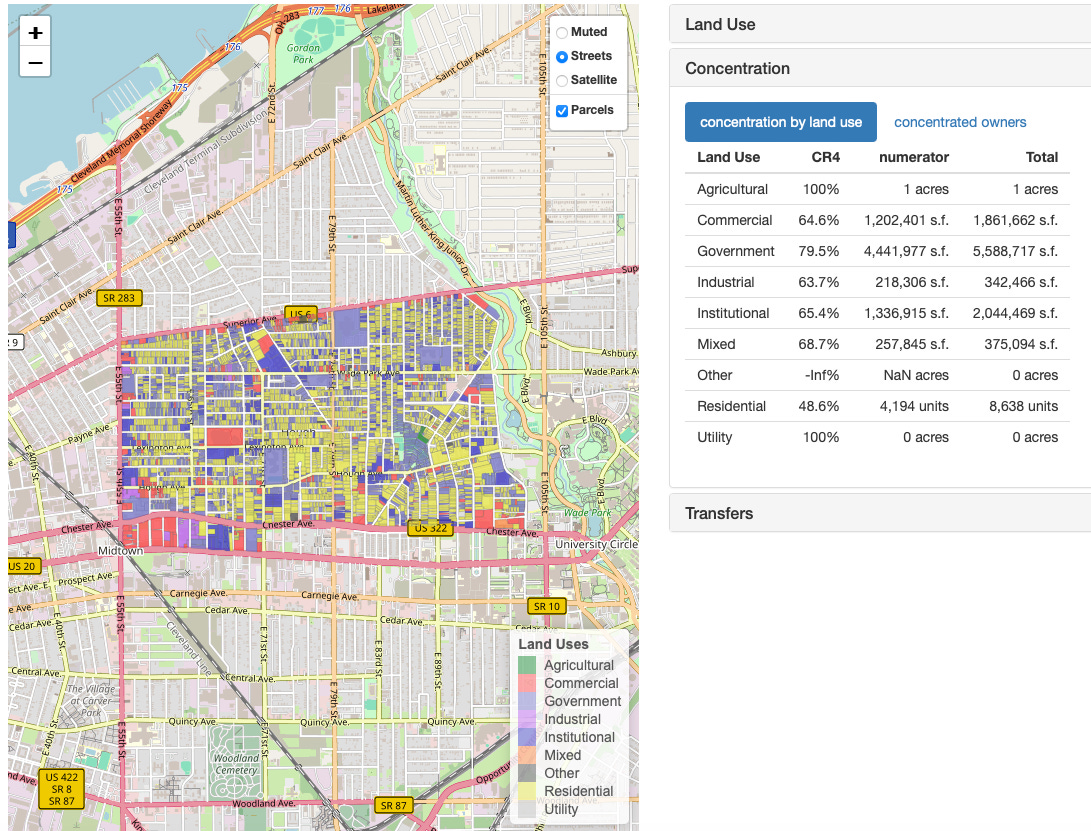
Figure 1 visualizes all land parcels within Hough. Different land uses are shaded in different colors. The chart on the right provides summary information about the current composition of the neighborhood’s current built environment. For example, Hough is comprised of 8,638 units of housing (both rental and owner-occupied), 48.6 percent of which are owned by the four largest owners (as measured by the overall CR4 – concentration ratio). The neighborhood contains 1.86 million square feet of commercial space (CR4=64.6%), 2 million s.f. of institutional space (CR4=65.4%), 5.5 million s.f. of government-owned space, 375K s.f. of mixed-used space, and 342K s.f. of industrial space.
More detailed data divide these general land-use categories into more specific sub-categories. For example, Hough’s residential parcels include 1,403 single-family homes as well as 3,865 housing units within low-rise housing complexes, each of which contains at least 40 units. This level of detail across each land use category can be compared to different scenarios of what Hough’s land use composition could look like in ten years if the 15-Minute City principles were more advanced.
FIGURE 1: LAND USES IN HOUGH
In addition, Figures 2A, 2B, 3A, and 3B visualize the most recent LODES data (2021) about how the Hough neighborhood relates to the dynamics of the labor market. These data can be used to assess how well Hough does, or does not, currently meet 15-Minute City ideals.
The intersecting circles on the right side of Figure 2A indicate that 3,078 residents of Hough were employed in 2021. Yet only 61 of those residents have jobs that are located within the neighborhood. The other 3,017 employed residents work outside the neighborhood.
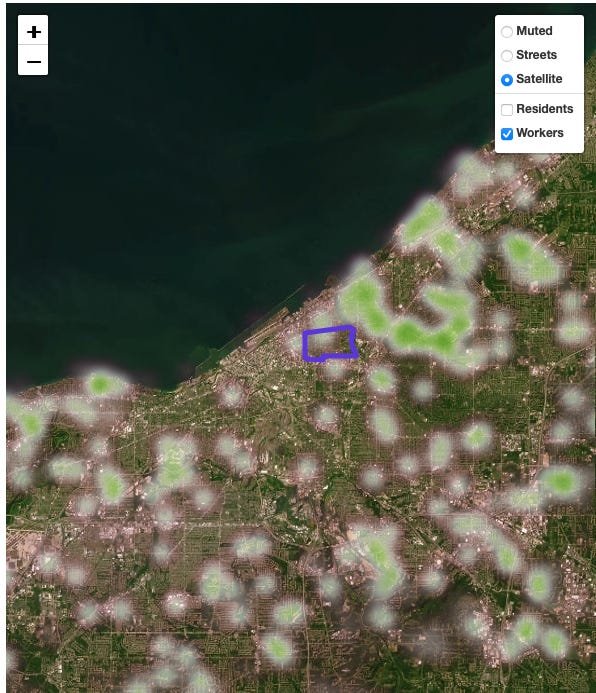
Figure 2B uses heat mapping to show where those employed residents work. The shaded census blocks on the left side of Figure 2A indicate where employed residents of Hough reside within the neighborhood. Additional demographic information about employed Hough residents (industry, age, income, education, race, ethnicity, and sex) are available by clicking on the categories below the circles.
FIGURE 2A: EMPLOYED RESIDENTS OF HOUGH
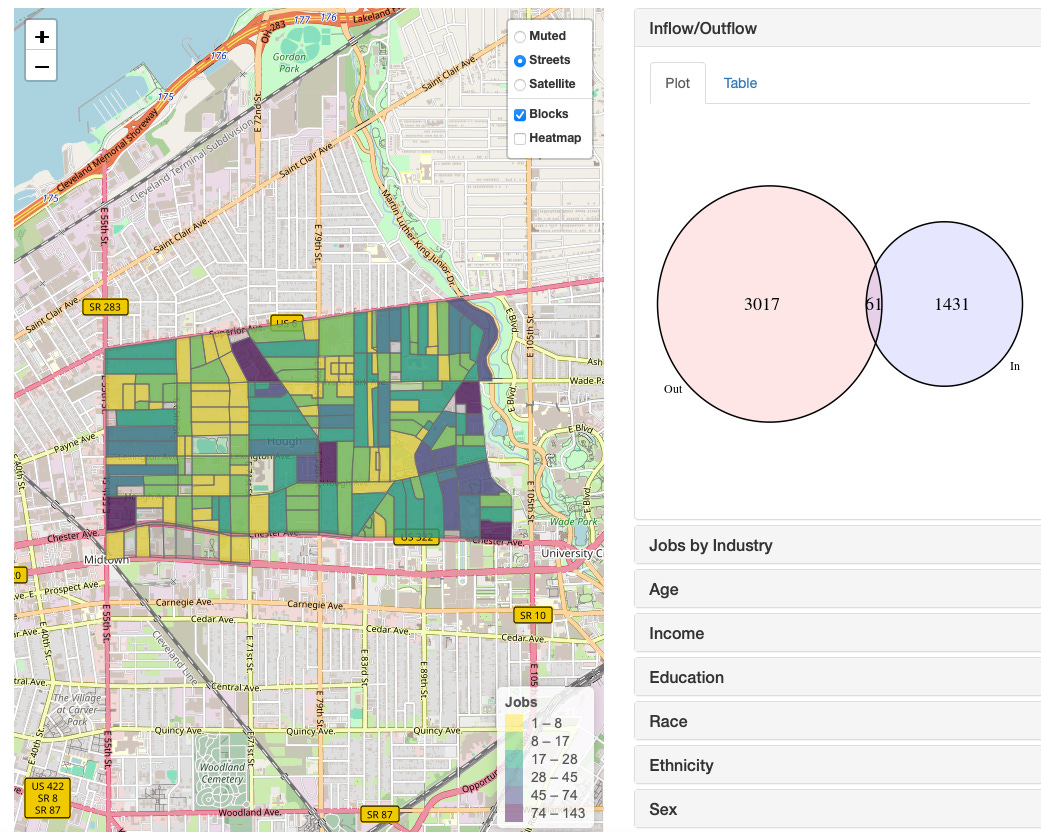
FIGURE 2B: WHERE EMPLOYED HOUGH RESIDENTS WORK
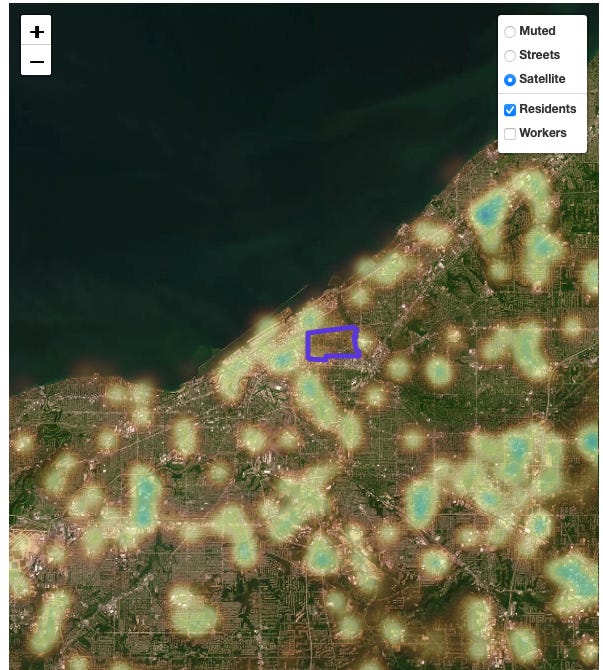
Figure 3A contains the same concentric circles on the right side as Figure 2A. But the shaded census blocks on the left side of Figure 2A indicate where jobs are located within the Hough neighborhood. The concentric circles indicate that in 2021 Hough was the location of 1,492 jobs, 61 of which were held by Hough residents and the remaining 1,431 were held by people who lived elsewhere. Additional demographic details about those who work in Hough are available by clicking on the categories in Figure 3A. Figure 3B uses heat mapping to visualize where those who work in Hough reside.
FIGURE 3A: JOBS LOCATED IN HOUGH
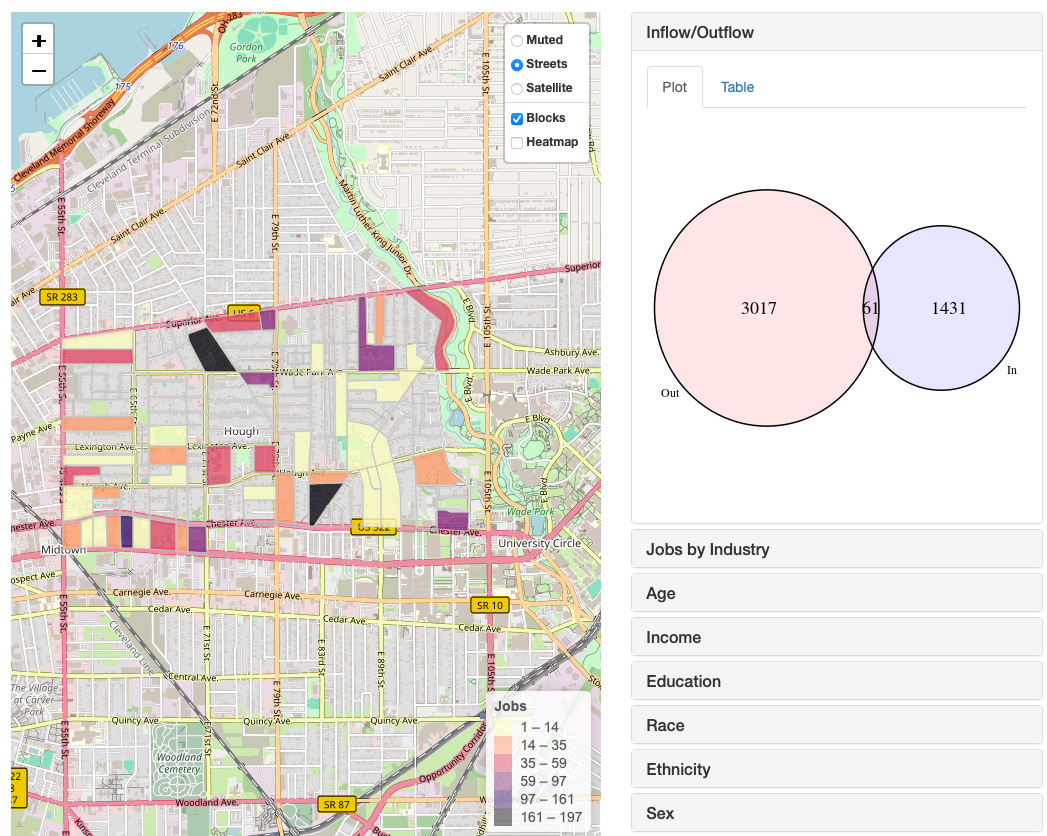
FIGURE 3B: WHERE HOUGH WORKERS RESIDE
Without the need for ultra-sophisticated Smart City data systems, which will take many years to emerge in most cities, existing administrative sources like parcel data and existing Census Bureau data systems like LODES can allow city and neighborhood planners to begin working with residents to develop initial priorities for changing the built environment and the dynamics of labor markets and job locations if the ideals of the 15-Minute City have appeal.
Parcel data can uncover the complex details of current land uses and the dynamics of neighborhood-specific real estate market segments for residential, commercial, institutional, and industrial buildings. LODES data can uncover what jobs are available within any specific neighborhood and how well the local demographics of employed residents matches the demographics of those who are already employed by for-profit and nonprofit organizations that are located in the neighborhood.
LODES data can also provide a rich understanding of the scale and scope of services that are, or are not, provided to local residents by existing local businesses including retail stores, commercial services, health care services, educational services, and even different types of entertainment.
These data, as well as other existing data sources, can be analyzed without undue difficulty to develop customized, creative strategies for each neighborhood to evolve current conditions toward the ideal conditions that would characterize the principles of the 15-Minute City. All this can be done with continual input from local residents, local owners of land and buildings, local employers, and other local stakeholders.
Gaps between ideal conditions and current conditions can be identified and sorted according to priority by planners, residents, and other local stakeholders. The gaps become the problems to be solved in order to achieve each component of the 15-Minute City ideals of affordable residential options for all income levels, employment opportunities for all skill-levels, the availability of retail and commercial services, health care services, educational opportunities, and entertainment options. Periodic updates to these data sources can become the basis for customized feedback dashboards and other measures that can monitor progress toward achieving each neighborhood’s priority goals.
Bob Gleeson
[1] Many cities have created visualization tools to visualize parcel data. Figure 1 is created by a tool developed by myself and Joseph Andre that uses Cuyahoga County, Ohio’s parcel data. The tool can be accessed at https://levinchair.shinyapps.io/Property_tool/.
[2] For detailed information on the LODES data, which is part of the larger Longitudinal Employer-Household Dynamics (LEHD) Program of the U.S. Census Bureau, see the documentation at onthemap.ces.census.gov. Figures 2A, 2B, 3A, and 3B are created using a tool developed by myself and Joseph Andre. The tool uses the synthetic LODES block-level data and can be accessed at https://levinchair.shinyapps.io/Lodes_tool/.
I wonder if we are being too purist about the 15-minute city, and especially at neighbourhood level. I seem to recall that when Edinburgh was first contemplating a development strategy based on a 20-minute city concept, they mapped the city to find areas which were not in reach of a basic set of facilities - schools, health centres, library, parks, grocery stores - within 20 minutes travel time by active travel and the areas identified were relatively few. It did give a good guide to where the gaps in provision were to decrease these areas further. But access meant reaching any such facility anywhere and not all necessarily within in the same neighbourhood. This access map is a long way from the ideal type 15 minute city concept, but is a reasonable proxy idea for established cities where re-development is challenging.